Tag Archives: BEBdata

The 2023 Used Car Market

Marketers anticipate a period of adjustment in 2023 for used car sales. Affordability due to higher interest rates and inventory challenges point to an anticipated slight decrease in sales.
Marketers forecast 18.9 million in retail used car sales for 2023 and 35.6 million for overall used sales.
Used car sales were down in 2022, with the rolling 30-day retails sales 9% behind 2021. The average listing price also saw a 4% decrease to $27,077.
By end of 2022, the used market saw a double-digit drop in vehicles priced between $25,000 and $30,000 and a near 10% drop in vehicles between $20,000 and $25,000. There has been a steady growth in wholesale inventory over the past six months.
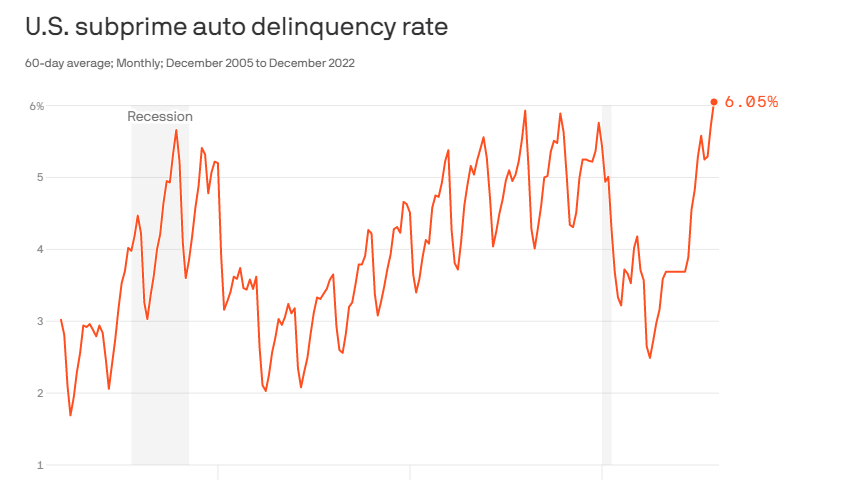
However, as prices retreat for used vehicles from record highs, affordability remains an issue, with high interest rates, 12%-13%. Rates are expected to climb, as the Federal Reserve tries to bring down inflation. The Fed in the past year has raised rates 425 basis points — the highest annual adjustment on record. The rising rates have dramatically impacted the subprime market. But the higher interest rates and costs have caused demand to slide throughout the industry.
The industry is trading a supply problem for a demand problem. With higher expenses comes lower demand.
Interest rates are not expected to decrease though hikes are expected to slow during the 3rd and 4th quarter.
Certified preowned vehicles (CPP) are expected to remain in short supply. Vehicles usually available for the CPO market were entering the rental car market at a higher rate throughout 2021 and 2022. CPO sales are expected to be around 2.2 million this year.
RESOURCE: National Independent Auto Dealers Association

Indicators Show Mixed Activity in Housing Markets

National housing market indicators available as of January showed activity in housing markets was mixed. Trends in some of the top indicators for this month include:

  • Purchases of new homes increased in December for a third
    consecutive month. New single-family home sales rose 2.3 percent
    to 616,000 units (SAAR) in December from a pace of 602,000 in
    November but were 26.6 percent lower year-over-year (y/y). Note
    that monthly data on new home sales tend to be volatile. For all of
    2022, new home sales reached 644,000, down 16.5 percent from
    771,000 in 2021 and their slowest pace since 2018. (Sources: HUD
    and Census Bureau)
  • Existing home sales fell for the eleventh consecutive month to their
    slowest pace since November 2010. The National Association of
    REALTORS® (NAR) reported that December sales of existing homes
    (including single-family homes, townhomes, condominiums, and
    cooperatives) slipped 1.5 percent to 4.02 million units (SAAR) from a
    pace of 4.08 million in November and were 34 percent lower y/y. For
    all of 2022, existing home sales dropped 17.8 percent to 5.03 million
    units from 6.12 million in 2021 and the slowest pace since 2014.
    Because existing home sales are based on a closing, December sales
    reflect contract signings in October and November. Mortgage rates
    have trended down since September, and month-to-month (m/m)
    house prices have remained the same or declined in the past several
    months—all of which should help to improve demand. Inventories
    of existing homes are still lean, however.
  • New construction of single-family homes rose to their highest level
    since August. Single-family housing starts increased 11.3 percent to
    909,000 units (SAAR) in December from a revised pace of 817,000
    units in November but were 25 percent lower y/y. Multifamily
    housing starts (5+ units in a structure), at 463,000 units (SAAR),
    fell 18.9 percent m/m and were 16.3 percent lower y/y. Note that
    m/m changes in multifamily starts are often volatile. Residential
    construction employment was up 3.2 percent y/y; residential
    construction costs were down 1.2 percent in December but up 6.9
    percent y/y. For all of 2022, total construction of new homes reached
    1.553 million units, 3.0 percent lower than in 2021 (1.601 million
    units and the strongest pace since 2006). New construction of singlefamily homes fell 10.6 percent, while starts on multifamily homes
    rose 14.5 percent in 2022. (Sources: HUD, Census Bureau and BLS)
  • Annual house price appreciation continued to decelerate in
    November, with annual gains ranging from 6.8 to 8.2 percent.
    The Federal Housing Finance Agency (FHFA) seasonally adjusted
    purchase-only house price index for November estimated that home
    values were down 0.1 percent m/m and rose 8.2 percent y/y, down
    from an annual gain of 9.8 percent in October. The non-seasonally
    adjusted CoreLogic Case-Shiller® 20-City Home Price Index, posted
    a 0.8 percent m/m decline in home values in November and a
    6.8 percent y/y increase, down from an 8.6-percent annual gain in
    October. Mortgage financing has become more expensive as the
    Federal Reserve raises interest rates, a process that began in April.
    The annual growth rate of house prices peaked in the spring of 2022
    and may well continue to decelerate. The home price data for both
    indices are based on real estate sales contracts signed in September
    and October with subsequent closings during November. (Both price
    indices are released with a 2-month lag.)
  • The inventory of homes for sale remained the same for new homes
    but fell for existing homes. The listed inventory of new homes for
    sale, at 461,000 units at the end of December, was unchanged m/m
    but was 18.5 percent higher y/y. That inventory would support 9.0
    months of sales at the current sales pace, down from 9.2 months in
    November due to an increase in sales. Available existing homes for
    sale, at 970,000 units in December, declined 13.4 percent m/m but
    were 10.2 percent higher y/y. That inventory represents a 2.9-month
    supply, down from 3.3 months in November. The long-term average
    for months’ supply of homes on the market is 6.0 months.
  • The U.S. homeownership rate fell slightly in the fourth quarter.
    The national homeownership rate decreased to 65.9 percent in the
    fourth quarter of 2022 from 66.0 percent the previous quarter but
    was up from 65.5 percent a year ago. The historic norm since 1965
    is 65.2 percent. (Source: Census Bureau)
  • Forbearance on mortgage loans remained the same. The MBA
    Forbearance Survey shows the share of homeowners with mortgages
    in forbearance was 0.70 percent (351,000 households) in December,
    the same as in the previous month, but down from 1.41 percent
    (705,000 households) one year ago. The forbearance rate was only
    0.25 percent of all home loans in the beginning of March 2020,
    before the economic effects of the COVID pandemic began to be felt.
  • Housing insecurity due to the pandemic remains elevated but
    has improved. HUD analysis of the Census Household Pulse Survey
    (Week 53: January 4-16, 2022) shows that approximately 11.4
    percent, or 5.25 million, renter households were behind on rental
    payments, an improvement over 15.1 percent, or 6.96 million,
    households one year ago. An estimated 4.6 percent, or 2.13 million,
    renter households feared eviction was imminent in the next
    two months, down from 7.1 percent or 3.17 million a year ago.
    Under Treasury’s Emergency Rental Assistance (ERA) program, an
    estimated 2.84 million renters have applied for and received rental
    assistance. Approximately 5.57 percent, or 4.59 million, homeowner
    households were behind on their mortgage payments in January, an
    improvement over 6.66 percent, or 5.50 million in January of 2021.
    An estimated 1.12 percent, or 890,000 homeowners, feared
    foreclosure was imminent in the next two months.
  • The 30-year fixed-rate mortgage (FRM) continued to ease, reaching
    its lowest level since September. The 30-year FRM reached an
    average weekly low in January of 6.13 percent the week ending
    January 26, 2023, down from the weekly low in December of 6.27
    percent and the lowest average weekly rate since last September
    (6.02 percent). The highest average weekly rate during that time
    frame was 7.08 percent in October and November. The mortgage
    rate was 3.55 percent one year ago. (Source: Freddie Mac)

Subprime Late Payments Increasing

Consumers with low credit scores are falling behind on their car payments a record rate.
Even with the strength of the current job market, cash-tight US households are suffering from two years of cost-of-living increases and the end of pandemic-related benefits.
Subprime payments for auto loans that were at least 60 days late rose to more than 6% in December.


According to data from S&P Global, December’s delinquency rate is a record, passing prior peaks just before the pandemic.
Contributing factors include the surge in the cost of living as the Consumer Price Index has jumped more than 14% over the past two years. Also, COVID federal aid to household such as expanded unemployment benefits are no longer.
We also see trends indicating that households are increasing their credit card usage, even though interest rates are hitting record highs.

Resource: Article written by Matt Phillips, author of Axios Markets
Data: S&P Global; Chart: Axios Visuals

Using BK Data to Sell Cars – Case Studies

A local dealership has been using our Lead Program for over 20-years.

Our Bankruptcy Leads help them sell an average of 15 additional cars a month.

They spent less than $60K (including postage) and generated over $360,000 in profit last year using our Bankruptcy Program.

We just completed a test program with another local dealership. We mailed 1,526 letters to people recently discharged out of bankruptcy. That generated 11 calls from 8 prospect which resulted in 3 cars purchased. That’s a 37.5% close rate! Cost per closed deal, including postage was only $522.

Our Special Finance Lead Program Works!


The USPS Holiday Heist

U.S. Postal Service Announces Proposed Temporary Rate Adjustments for 2021 Peak Holiday Season

WASHINGTON – The United States Postal Service filed notice the Postal Regulatory Commission (PRC) regarding a temporary price adjustment for key package products for the 2021 peak holiday season. This temporary rate adjustment , which was approved by the Board of  Governors Aug. 5, will affect prices on commercial and retail domestic competitive parcels – Priority Mail Express (PME), Priority Mail (PM), First-Class Package Service (FCPS), Parcel Select, USPS Retail Ground, and Parcel Return Service. International products would be unaffected. Pending final approval by the PRC, the temporary rates will go into effect on Oct. 3, 2021, and remain in place until Dec. 26, 2021.

The planned price changes include:

Priority Mail, Priority Mail Express, Parcel Select Ground and USPS Retail Ground:
• $0.75 increase for PM and PME Flat Rate Boxes and Envelopes.
• $0.25 increase for Zones 1-4, 0-10 lbs.
• $0.75 increase for Zones 5-9, 0-10 lbs.
• $1.50 increase for Zones 1-4, 11-20 lbs.
• $3.00 increase for Zones 5-9, 11-20lbs.
• $2.50 increase for Zones 1-4, 21-70 lbs.
• $5.00 increase for Zones 5-9, 21-70 lbs.

A full list of commercial and retail pricing can be found on the Postal Service’s Postal Explorer website https://pe.usps.com/text/dmm300/Notice123.htm

First Class Postcards Just Got Bigger

On July 28, 2021, the Postal Regulatory Commission (PRC) approved increasing the size limit for a Presorted First-Class Mail (FCM) Postcard. The new 9″ by 6″ maximum size card has a slightly different minimum thickness of .009″ compared to the previous  maximum size dimensions of 6″ by 4.25″ with a minimum thickness of .007″. (The minimum .007″ thickness still applies to cards less than 6″X9″).

Previous dimension restrictions made it easy for First-Class Postcards to “get lost” in the mailbox as larger pieces pulled away attention, and marketers didn’t have the needed space to sell products or services. The Postal Service argued that the proposed change would make the First-Class Postcards more valuable by creating new opportunities for marketers and nonprofits to take advantage of technologies such as QR codes and variable personalization making them even more effective.

Being able to send larger cards using First-Class Postcards rates will also give mailers faster delivery service circumventing the recent reduction of delivery standards recently implemented.

See the size comparison below:

Gathering Data on Your Customers & Prospects is Changing

In the past, dealerships haven’t considered using their customer data as a source for advertising. That data was primarily used for sales follow-up calls or service inquiries.

That’s because third-party cookies (small pieces of text sent to your browser that remembers information about websites you visit on the internet) are becoming extinct. Privacy regulations and laws are driving digital giants to stop the use of them. Apple’s latest update allows users to opt out of ad tracking, Firefox and Safari have already stopped storing cookies, and Google will phase them out of Chrome by 2023.

The loss of cookies will make it more difficult to target people who previously visited dealership’s websites making digital ads less personalized.

The good news is that dealerships have a treasure of data of their own. Customers’ emails, addresses, phone numbers, details of their automobiles and more. This data is collected through CRM systems and dealership websites. It’s known as first-party data.

Social media companies can continue to track their user activity within their own platforms which helps to build an audience and allow for retargeting through advertising directly through the platform such as Facebook or Instagram. Social media is facing extreme challenges with the newly introduced privacy options as Apple user opt out of ad tracking, social platforms lose their ability to identify their user locations.

With the recent change in size regulation for First-Class postcards (from 6 X 4.25 to 6 X 9), dealers are beginning to revisit direct mail.

Data compilers can help to “fill in” missing data from dealers first-party data through a reverse append. You provide us with your data, name/address/city/state/zip and we can append phone numbers, email addresses, and run the data through cleansing software that will update records based on the National Change of Address Database, standardize the address information, and check the addresses for accuracy.

To learn more about reverse appends contact us today.

Consumer Bankruptcy 10 yr Comparisons

In 2000, 1.2 million people filed for bankruptcy compared to 1.5 million in 2010. That was a 26.2% increase. The chart above shows comparisons, by year, for a decade. 2001 – 2005 compared to 2011 – 2015 showed significant decreases, up to 59.8% between 2005 and 2015. 2006 compared to 2016 showed a 28.9% increase in filing, then the reduced number of filings trend resumed.

BK Filings – A Tidal Wave on the Way?

So far, a surge of personal bankruptcies has been avoided during 2020 and to date, bankruptcy filings are trailing last year’s numbers.

Even though the federal stimulus payments and other government programs most likely have a lot to do with 2020’s decline in consumer bankruptcies, it could also be attributed to people borrowing less. However, consumer bankruptcies are likely to rise if unemployment and income loss continue.

Some industry experts forecast a “tidal wave” of filings starting in the fourth quarter of 2020 and gaining momentum after the first of 2021.

Mortgage forbearance nearing its end could also be the start of a significant bankruptcy filing surge. You remember that part of the CARES Act allowed homeowners with federally backed mortgages to stop making payments for periods of six months, with a possible extension of six additional months. Starting as soon as October 1, affected homeowners will not only have to resume payment, but banks could demand immediate make up of all missed payments.

Depending on how lenders work with those who exercised the deferral, a wave of Chapter 13 bankruptcies could begin. Chapter 13 allows debtors to set up a repayment plan usually allowing three to five years to catch up on payments.

Bankruptcy booms have happened in the past but it’s unlikely that even Covid-19 could produce anything like the historical peak of filings in 2005. In October of 2005, a new law, the Bankruptcy Abuse Prevention and Consumer Protection Act, went into effect. Because it was seen as less favorable to borrowers, people rushed to court before the law’s effective date resulting in a short-term surge of filings. Soon after, filings dropped (significantly) and stayed low until the housing bubble began to collapse in 2007. The next peak was seen in 2010 as foreclosures skyrocketed.

In any case, looking for trends in this unprecedented time may be futile, as nothing is normal during the “new norm”. We will continue to keep you abreast of current trends as they unfold and share industry analysis and forecasts through our weekly blog.

Up & Down – Which RE Markets Get Hit

A recent UBS report says that housing prices in areas where the economies depend on leisure and hospitality will be under greater pressure than other areas. The report mentions Las Vegas, Miami and Orlando, which were some of the more disastrous markets during the subprime crisis.

Home prices were hot at the start of 2020. As we muster through the pandemic, gains in values will likely slow. However, prices are not expected to fall nationally. There is a severe shortage of homes for sale which is unlike the subprime mortgage crisis. Home values fell as much as 50% in some markets 10-years back. Now, the supply-demand imbalance favors stronger prices.

Although numbers are still rising compared to 2019, (in the first two weeks of March, new listings were up 5% annually on average), slower gains are indicative to the current market, (the second week of April, new listing were down 47%). There has also been a slowdown in asking prices. In early March, median list prices were, on-average, up by 4.4%. The first half of April reported the slowest growth in seven years with an increase of just under 1%.