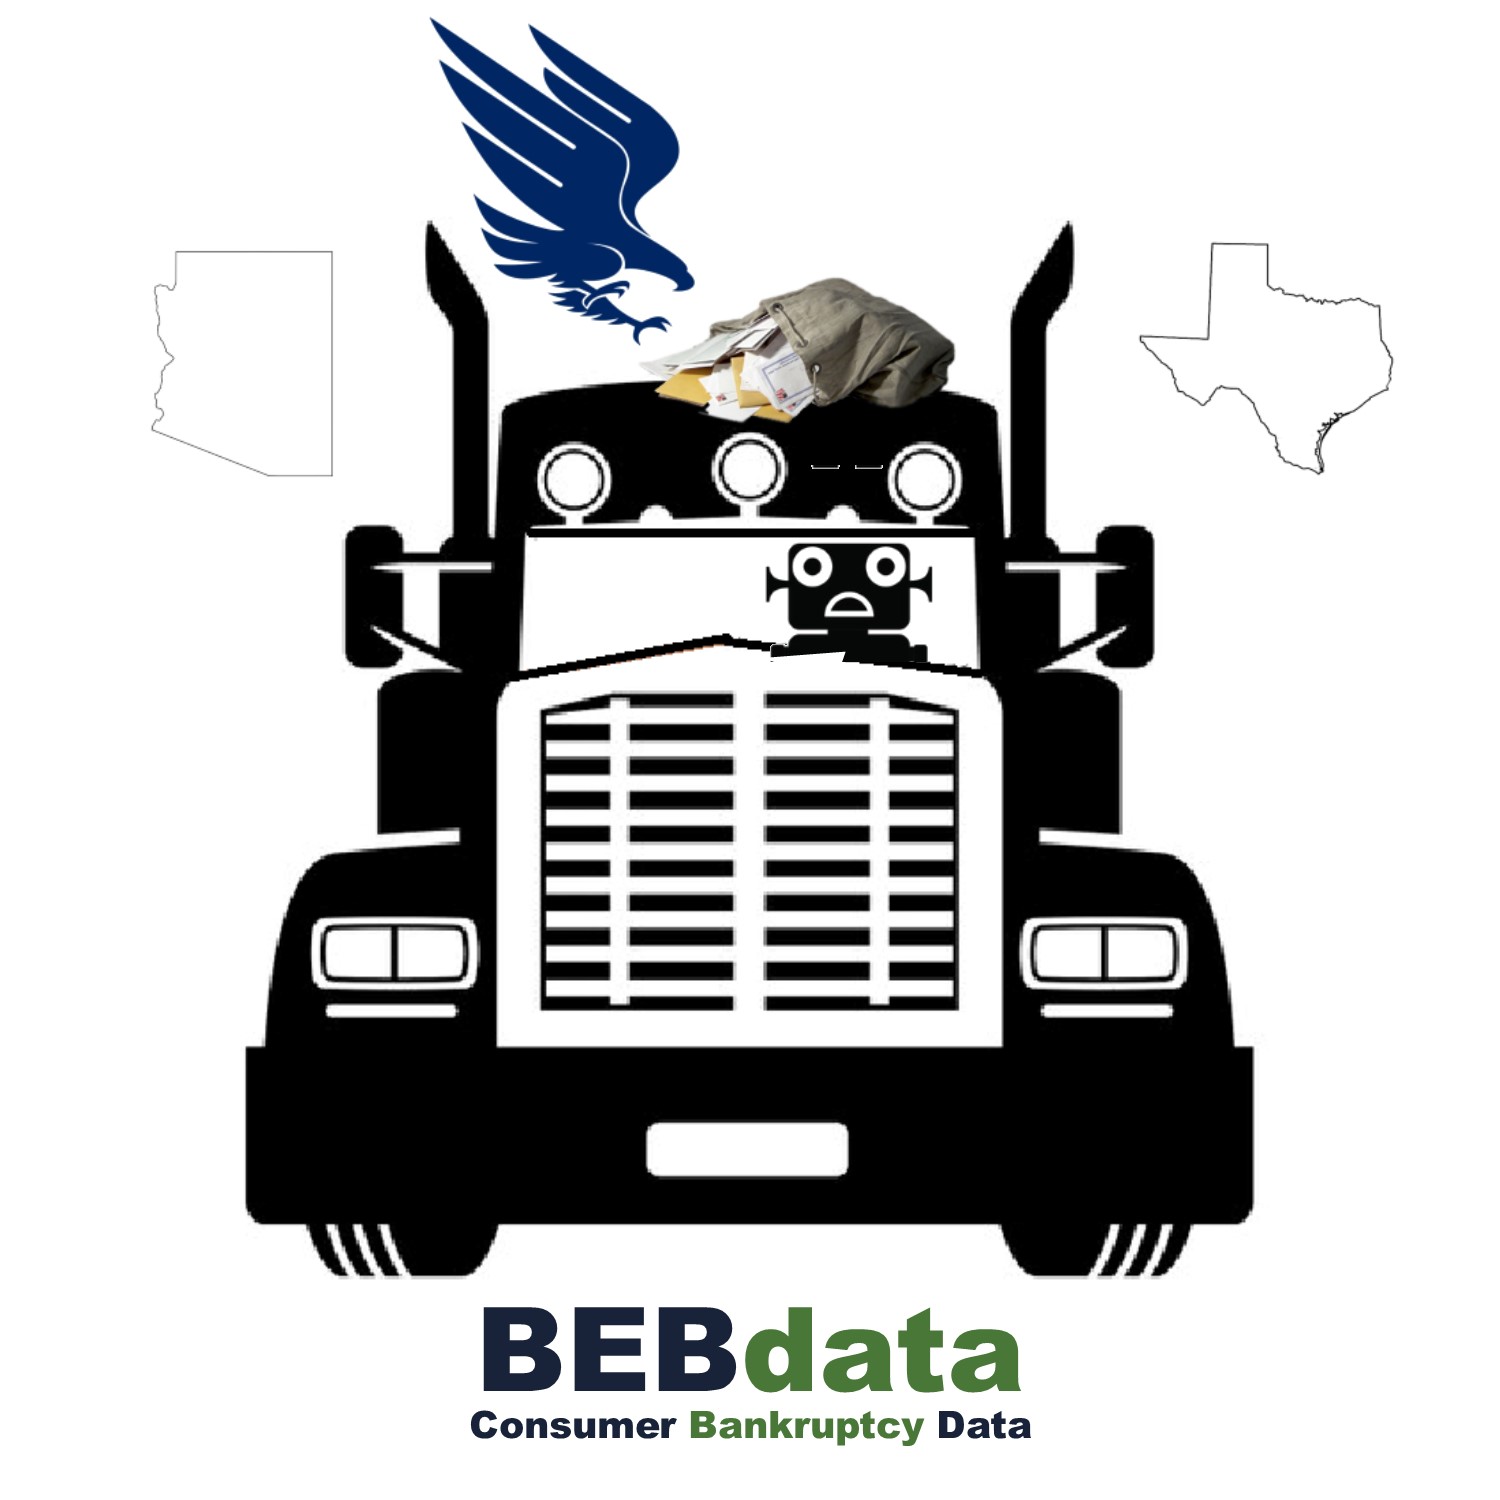
Author Archives: BEBdata

Carbon Fiber Car Construction

The trend in construction of new vehicles using lighter weight substrates continues. According to an article by MPower, much of the focus is placed on aluminum but many automakers are turning to carbon fiber not only for exterior components but also complete inner body structures. Some of Volvo’s hybrids inner structure are primarily carbon fiber. This reduces weight and enhances rigidity. Carbon fiber is also in the  Silverado/Sierra trucks where GM is using carbon fiber in the construction of new bed assemblies.  Industry analysts predict a compound annual growth rate of the automotive carbon fiber market between 7.9 percent and 10.6 percent for the coming five years.

2025 CAFE Standards

  • By 2025, passenger cars and light-duty trucks in the U.S. must meet Corporate Average Fuel Economy (CAFE) fleet standards of 54.5 miles per gallon (MPG).
  • Between 2017 and 2025, vehicle manufacturers are required to achieve annual efficiency gains of 5% and 3.5% respectively.
  • In a report from the Environmental Protection Agency (EPA), technological innovation remains the primary driver behind vehicle improvements in fuel economy.

The Fast Slow Auto Market

This year, the auto industry will grow 2.0% to $1.299 trillion, the slowest growth rate since at least 2011. Growth will flatten through 2022, according to eMarketer’s latest US retail forecast.

Based on an article by eMarketer,  that says that US light vehicle sales have been off to a slow start this year. Cindy Liu, forecasting analyist said that will contribute to the slowdown in the overall US retail market. Auto buyers remain hesitant to purchase new vehicles amid uncertainty surrounding the economy and rising interest rates.

The auto industry represents 23.7% of all US retail sales, making it the largest retail sector. As a result, it has a large impact on the aggregate. eMarketer says that total retail sales in the US will grow 3.0% in 2019 to $5.475 trillion. Because the auto industry represents nearly one-quarter of total US retail, any growth or contraction will have an outsized effect.

32% of Chapter 7 bankruptcies carry student debt

According to a new LendEDU study, 32% of consumers filing for Chapter 7 bankruptcy carry student loan debt. Of that group, student loan debt comprised 49% of their total debt on average.

As of 2019, student loan debt is at an all-time high with a national total of $1.5 trillion. According to Student Loan Hero, the average student-loan debt per graduating student in 2018 who took out loans was $29,800.

The LendEDU data shows the effects of the growing burden of student loan debt. Coupled with a high cost of living and the fallout of the recession, student loans make it harder for millennials to save and put them financially behind — to the point where they may need to declare bankruptcy to be able to pay them off.


BK is going gray

The social safety net for older Americans has been shrinking for the past 20 years or so. Reduced income, and increased healthcare costs, are now financial risks associated with aging. A new trend is emerging, older Americans are increasingly likely to file consumer bankruptcy. Using data from the Consumer Bankruptcy Project, the SSRN (Social Science Research Network) reported finding more than a two-fold increase in the rate at which Americans aged 65 and over file for bankruptcy.  Also reported, an almost five-fold increase in the percentage of older persons in the U.S. bankruptcy system. The magnitude of growth in older Americans in bankruptcy is so large that the broader trend of an aging U.S. population can explain only a small portion of the effect. The SSRN data indicates that older Americans report they are struggling with increased financial risks, namely inadequate income and unmanageable costs of healthcare, as they try to deal with reductions to their social safety net. As a result of these increased financial burdens, the median senior bankruptcy filer enters bankruptcy with negative wealth of $17,390 as compared to more than $250,000 for their non-bankrupt peers. For an increasing number of older Americans, their golden years are fraught with economic risks, the result of which is often bankruptcy.

Read more here.

BK Climbing in 2019

Is the trend of declining bankruptcy filings coming to an end?  There are some key indicators that suggest it.

A 2019 report from the American Bankruptcy Institute (ABI) indicates that consumer bankruptcy filings are on track to increase notably for the first time in years. The ABI shows that total U.S. bankruptcy filings increased 3% in July from the previous July; consumer bankruptcy filings increased at the same 3 percent rate year-to-year, with 61,025 consumer filings in July 2019, up from 59,110 in July 2018. Consumer bankruptcies also rose about 5 percent month to month from June to July 2019 (from 58,003 to 61,025).

The New York Post noted that if the trend continues, the overall total of [personal and business] bankruptcies is on pace to hit 796,000 which far exceeds last year’s totals.

Data from the ABI suggests that household debt is roughly $14 trillion, which is $1 trillion more than the 2008 Great Recession peak.  Credit card debt is $1 trillion and also exceeds the 2008 peak, which could make households more likely to turn to bankruptcy as a means of relief moving forward.

3rd Quarter Consumer Financial Protection Bureau Report

The Consumer Financial Protection Bureau (Bureau) released the 3rd quarter consumer credit trends report (qCCT), which describes how the volume and types of bankruptcy filings have changed throughout the period 2001 – 2018, which includes the Bankruptcy Abuse Prevention and Consumer Protection Act (BAPCPA) and the Great Recession.

The report analyzes data from the Bureau’s Consumer Credit Panel (CCP), a longitudinal, nationally representative sample of approximately five million de-identified credit records maintained by a nationwide credit reporting company. The report focuses on consumers who filed for Chapter 7 or Chapter 13 bankruptcy between 2001 and 2018. Under a Chapter 7 bankruptcy, a debtor’s non-exempt assets are liquidated in order to repay creditors and the remaining debt is generally discharged. Under a Chapter 13 bankruptcy, debtors enter into a repayment plan to repay a portion of their debt.

Key findings include:

  • From 2001 – 2004 about 75 percent of personal bankruptcy filers used Chapter 7. BAPCPA, which took effect in October 2005, restricted access to Chapter 7 by establishing a means test for those with income above a certain limit. This created a rush to file before BAPCPA took effect and increased the share of Chapter 7 filings to 80 percent of all personal bankruptcy filings in 2005. In 2015 – 2018, with the effects of the Great Recession fading, Chapter 7 filings appear to have stabilized at about 63 percent of personal bankruptcy filings.
  • Bankruptcy petitions generally result in a discharge or dismissal. A dismissal occurs when the debtor does not meet the requirements set by the court. Nearly all Chapter 7 filings result in a discharge of debt, which takes about four months. Less than half of Chapter 13 filers complete their repayment plans and receive a discharge.
  • Median credit scores of Chapter 7 and 13 filers one year prior to filing increased after BAPCPA but declined starting in 2010 possibly because filers experienced a negative financial shock during the Great Recession which lowered credit scores.
  • On average, Chapter 7 and 13 filers had more than twice the mortgage debt during the Great Recession than in the periods before and after. This is consistent with the financial shock of the recession causing more homeowners to file for bankruptcy.
  • Median credit scores increase steadily from year-to-year after consumers file a bankruptcy petition. Median scores for Chapter 7 filers recover more quickly than those for Chapter 13 filers possibly due to the much quicker and more likely discharge of Chapter 7 filings. Both Chapter 7 and 13 filers who filed in 2001 – 2004 received a second shock in the form of the Great Recession which slowed the recovery in median credit scores.
from https://www.consumerfinance.gov/about-us/blog/new-report-explores-trends-consumer-bankruptcy/