 Minneapolis, MN – Can you believe that we’re already in the 3rd quarter of 2013?! The Holiday season seems like it was just yesterday and I was in Houston, visiting our corporate office, cheering on the Minnesota Vikings as they beat Houston!
In February, Sherry Merritt (Client Services) and I attended NADA 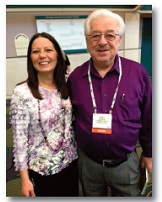 (National Auto Dealers Association) Conference in Orlando, Florida. This conference is unique as it provides a platform for the entire automotive industry to come together. In addition to over 1,900 dealerships present, there were hundreds of allied industries there. We had a great time with some of our existing clients and met a few new ones too! Our Sherry Merritt is pictured here with Larry Stiver of VIP Marketing, Inc at NADA2013!
 March brought us a milestone in the social media venue as our Twitter account (@bebdata) reached 300 followed and we have over 300 views on our Facebook page. Thank you!
In April we received our first Graphic Excellence Award (GEA) for our 2012 Interactive Holiday Card! Presented by the Printing Industries of the Gulf Coast, we are excited to be recognized by this prestigious organization. May brought us another milestone in the social media arena, as our YouTube videos were viewed over 500 times, spanning 10 countries! We also launched our BEBdata LinkedIn page, so be sure to follow us as we blog weekly BK statistics along with other industry news.
 In the next six months, we’ll attend the ABA Marketing Conference in San Antonio, TX (September) and are looking forward to the big DMA show in Chicago, Illinois in October.
We are very grateful to you, our valued clients, and are always looking for ways to improve or add-on services. If you have a request, please give me a shout. Our goal is to make sure all of your business needs are being met with your satisfaction.
Sincerely,